Research result 2019
Overview of 2019 fiscal year
In FY 2019, we proceeded with the collection of detailed data such as probe data and video data, conducted detailed analysis using these data and reflected the results in models, built an evaluation system, examined the specifications of a platform for sharing the collected data and results, and developed visualization methods. In addition, a social experiment to introduce a new service using SSM (Smart Small Mobility) is scheduled to be conducted during fiscal 2020, and in fiscal 2019 we constructed a detailed plan for its implementation and selected a location for its implementation.
Continuing from FY2018, four groups advanced their research and development. Each group’s results for FY2019 are as follows.
Group 1 Leapfrog Urban Design Integrating Land Use and Transportation
Continuing from FY2018, we collected available data to understand the current urban activity and organize the future transportation network based on various remote sensing data and transportation planning documents. In particular, we obtained GTFS data of public transportation throughout the Bangkok metropolitan area, which is valuable as input information for simulations, and received detailed demographic data from Group4.
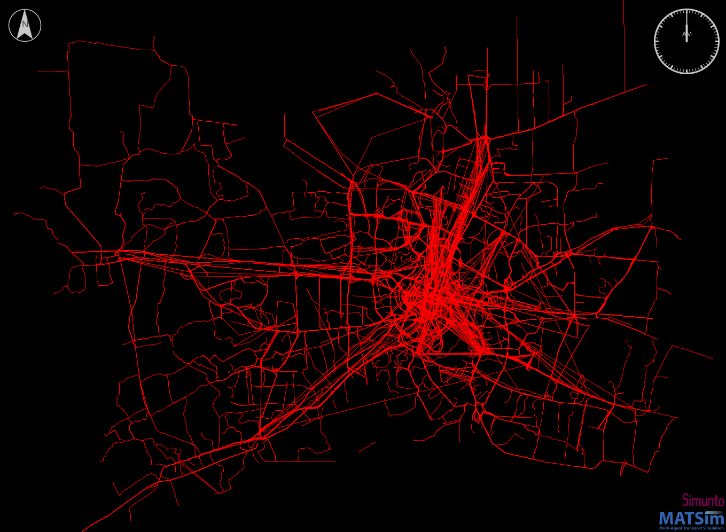
Public transportation network with GTFS data 
Visualization of operation status by MATSim
We collected information on TOD (Transit Oriented Development) around railroad stations. The Thai government has been trying to promote TOD around railway stations, and MRTA, in cooperation with the National Housing Authority (NHA), has considered developing housing near railroad stations, but the current law prohibits MRTA from developing anything other than railroad projects, so such attempts have not been realized. However, the current law prohibits the MRTA from developing anything other than railroad projects, so such an attempt has not been realized. On the other hand, with regard to the development profit return policy, new legislation has been put in place to tax commercial buildings with a value of 50 million baht or more within 5 km of the railroad line, confirming that the analysis of railroad development and its surrounding development and demand trends is highly necessary in policy making.
Data on public transport operations in Bangkok were obtained and reflected in the microsimulation model, and the shape of the future public transport network was analyzed to estimate the potential location of urban service facilities. In addition, based on the Bangkok Person Trip Survey data obtained in FY2018, we set up a prior distribution of activity times that generate traffic demand, and used MATSim, a traffic microsimulation model, to estimate the departure times and travel routes of individual agents related to road traffic. By doing so, we estimated traffic congestion and travel time distribution by time of day, and also estimated the situation of changing departure time to avoid traffic congestion.
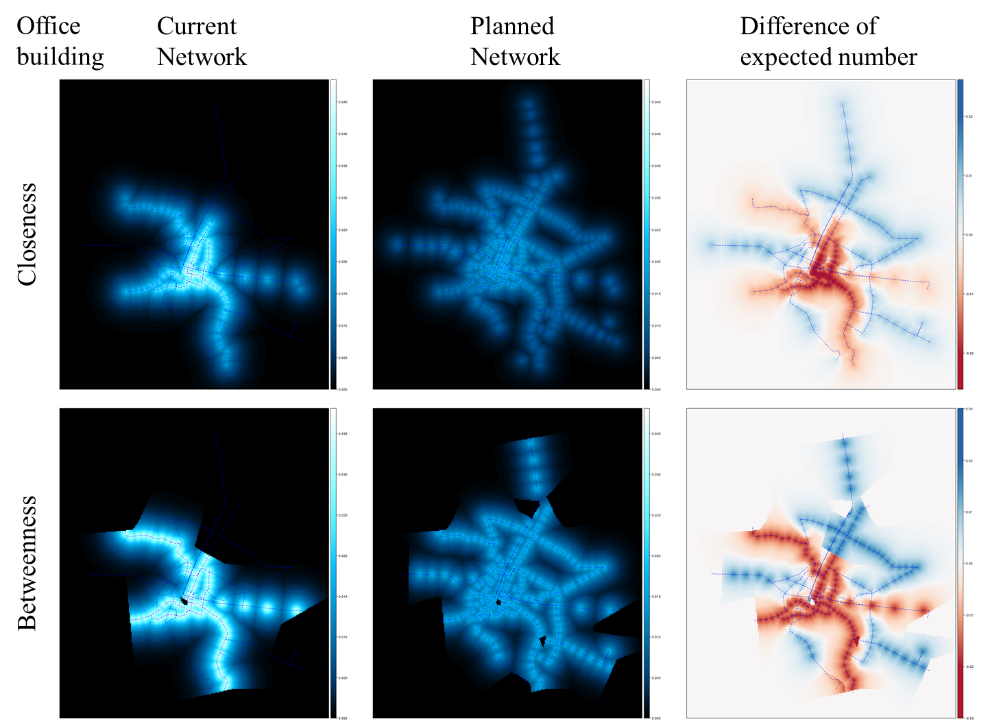
Estimating the potential location of urban service facilities
(Example: Office building)
Estimation of allocated traffic volume by MATSim (trial calculation)
Group 2 Smart Transportation and Urban Design for Integrated Public Transportation Connections and Street for All
The following four items were identified as effective development items for smart transportation and urban district design in Thailand: “District transportation services using small electric mobility,” “Methods for studying traffic congestion countermeasures using probe data,” “Walkability evaluation and design methods,” and “MaaS services that take into account personal attributes and district characteristics.
We planned and prepared for a social experiment to demonstrate a small mobility service. We conducted interviews with commercial facilities, condominiums, and paratransit operators in the city center of Bangkok to investigate the actual situation, and selected the location for the social experiment. In addition, through consultations with relevant government agencies, we sorted out the laws and regulations and systems necessary for service provision and obtained probe data.
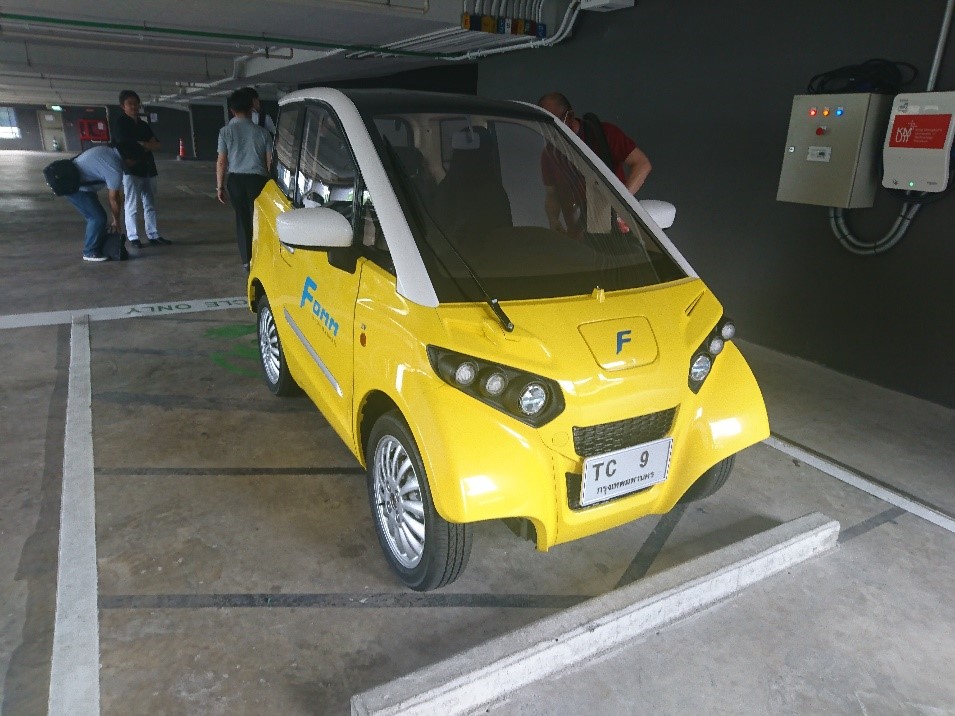
Smart Small Mobility (FOMM) 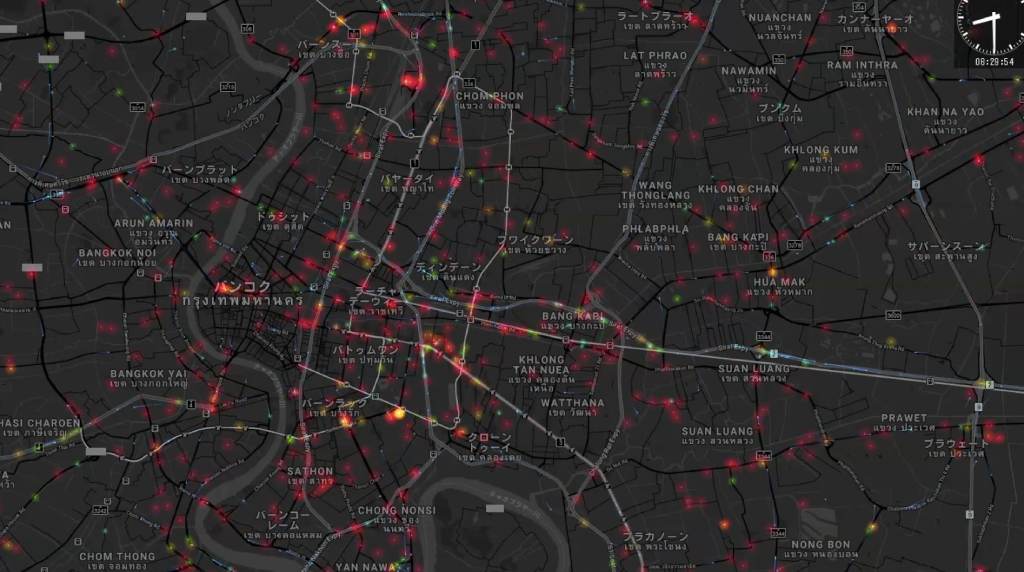
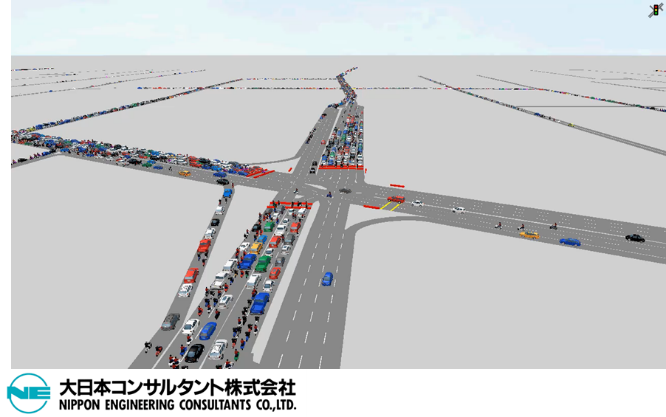
Visualization of Probe Data
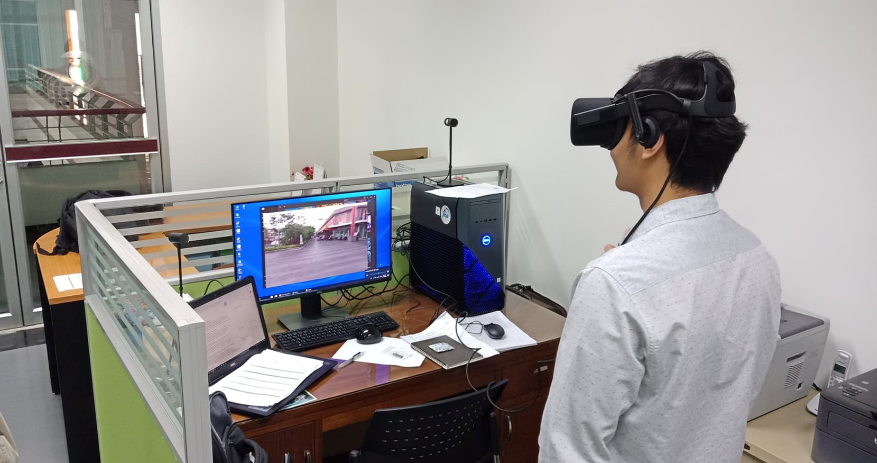
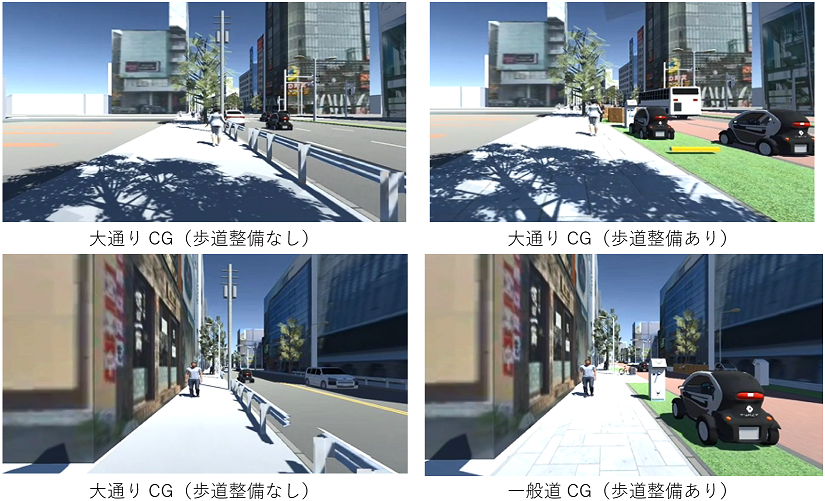
In order to evaluate the quality of movement for station access, we organized the Walkability evaluation index, which evaluates walking space with perceptual indexes consistent with QOL indexes, and the design elements of streets, and evaluated internationally diverse street spaces using VR tools (360 degree video and HMD). We also modeled the relationship between perceptual elements and design elements using SEM (Structural Equation Modeling: Analysis of Covariance Structure) using the results of the VR tool evaluation for Japanese people. We have also started a similar survey of Thai people. In addition, we have created a basic CG model for the Street Design for All proposal. Here, we modeled the street design, road design, and traffic situation including small mobility in CG, and conducted a trial evaluation experiment on this simulated walking.
Using probe data, we analyzed the characteristics of traffic congestion in the city center of Bangkok to understand the mechanisms. In the characteristics analysis, we studied how to extract bottlenecks that are the starting point of traffic congestion by focusing on time of day, route, weather conditions, etc., and how to counter these bottlenecks. At the same time, we started to develop a system to visualize the effects of traffic congestion countermeasures through microsimulation, and clarified the effects of countermeasures through a combination of complex measures.
Group3 Multi-scale Evaluation System for Urban Policy Based on Quality of Life
Group 3 is an attempt to apply image processing technology using AI as an evaluation method. In this fiscal year, we studied the technical aspects and developed an evaluation system.
We conducted an experimental questionnaire survey to estimate QOL by acquiring images of Bangkok scenes. Although more data is needed for deep learning, we first researched elemental technologies in preparation for collecting a large data set. First, we researched elemental technologies to prepare for the collection of large datasets. For general object recognition, we researched the automatic acquisition of images from the Internet for recognizing TukTuk, which is unique to Thailand, and attempted to automatically acquire training datasets for use in general object recognition. We also conducted research on outputting factors such as the degree of congestion on roads for cars and people as a preprocessing step for estimating QOL using image recognition technology.

Trial of QOL estimation questionnaire survey
There are two independent methods for general object recognition: object detection (Boundary Box) and semantic segmentation (Region Segmentation). We have developed a deep learning model to efficiently realize the different tasks of detection and region segmentation by devising an efficient network model to realize the two tasks simultaneously and evaluating its performance.
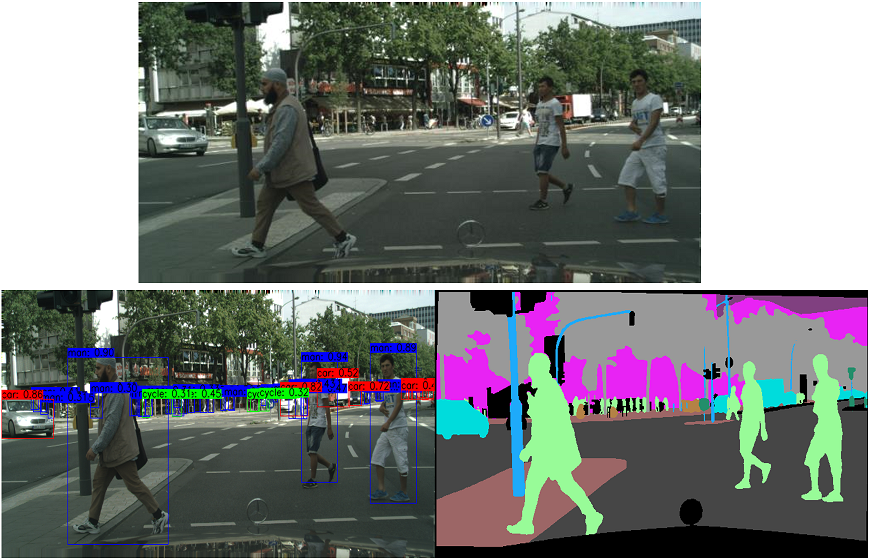
Object recognition (left) and semantic segmentation (right) of a city image.
We are developing a method to estimate QOL from the facial expressions of a subject while moving or viewing an image. After completing the development of a system that can detect multiple faces in an image and identify individuals, we are now developing a system to estimate QOL from facial expressions. Furthermore, in order to measure how street characteristics and other factors affect the above QOL, we have conducted test flights of UVM (unmanned aerial vehicles) in Japan, and from these aerial photography screens, we have developed Deep Learning software to determine the Walkability and Cozy of streets from images.
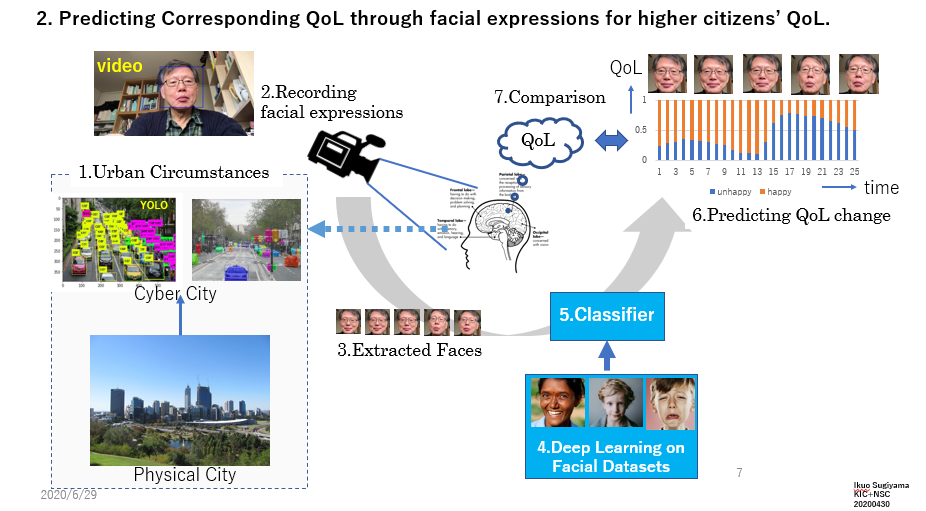
Estimating Quality of Life from Facial Expressions 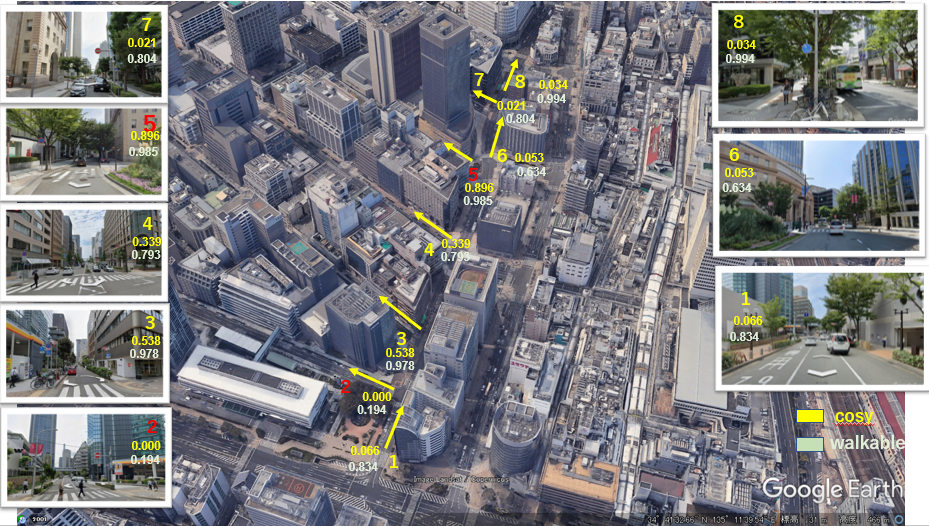
Development of Deep Learning Software
to Estimate Walkability and Cozy from Images
The current values of Bangkok’s residents are expected to change with the future economic development and changes in social conditions. Therefore, in order to develop a method for predicting future changes in the values of Bangkok residents, we analyzed the results of research on QOL evaluation in various cities, as well as the relationship between QOL evaluation and the underlying economic and social conditions. As a part of this project, we conducted a survey on the actual situation of Congestion Charge in London and the planned Ultra Low Emission Zone as an advanced example of urban policy. At the same time, we participated in MOVE 2019, an event on urban transportation, and collected the latest information on policies, laws, technologies, and projects related to cities and transportation in various countries, cities, and companies around the world. Based on the results, we presented the concept of a sustainable smart city that will be operated by humans and AI in cooperation in the future.
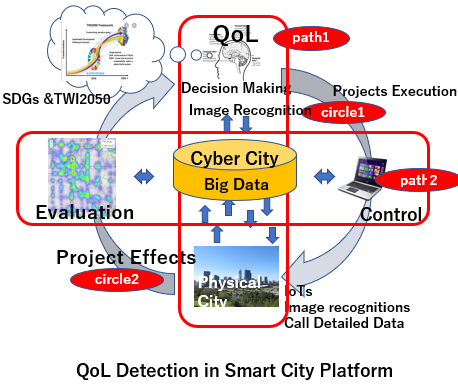
Group4 Integrated Visualization and Decision Support System by Digital Earth System
Digital Earth is a bird’s-eye view information infrastructure that integrates and visualizes a variety of spatial information, and is expected to be used as a decision support tool for taking a comprehensive and multifaceted approach to problem complexes of various spatio-temporal resolutions. Group 4 is using Digital Earth to develop a system that integrates and visualizes on a map the land use status, traffic volume, future projections, and people’s quality of life in a target area so that urban transportation policy makers (e.g., BMA Transportation Bureau) can make decisions using the smart transportation integrated strategy method.
Using the geospatial data acquired in FY2018, we made a prototype of microgeodata for Asok station area, Thong Lo district, and Thonburi district, and obtained individual data of 2010 census from National Statistics Office as validation data. In order to improve the accuracy of Grop1’s agent simulations, we discussed with Grop1 how to use the resulting data, and formulated the data specifications of the microgeodata.
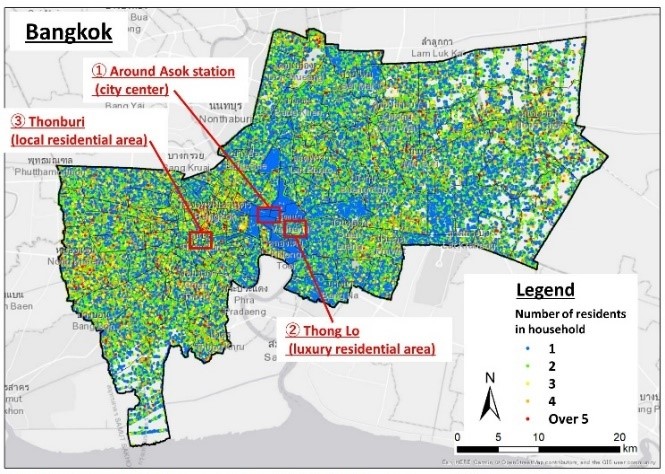
Micro-population data for Bangkok under development 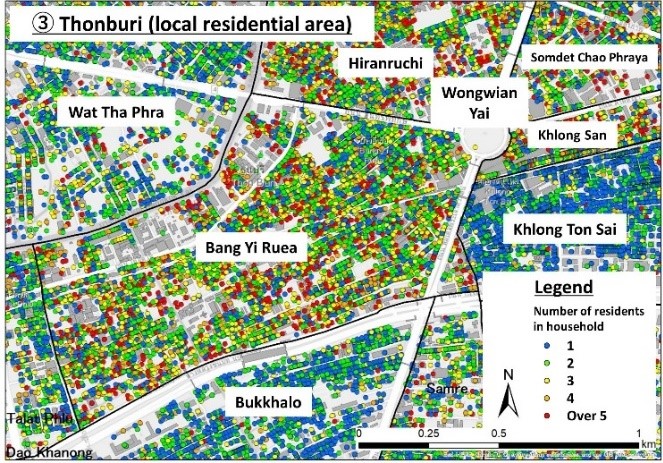
Thonburi District
The specifications for low-cost Global Navigation Satellite Systems (GNSS), which were considered for introduction in FY2018, were defined and procured, and the assembly procedure for GNSS equipment was established through discussions with experts and is ready for commissioning. In addition, a data management system for vehicle GPS trajectory loggers has been developed at Thammasat University and is being tested. In addition, we have created a data formatting module to use vehicle probe data from iTIC (Thai Intelligent Traffic Information Center) for agent modeling in Group1.
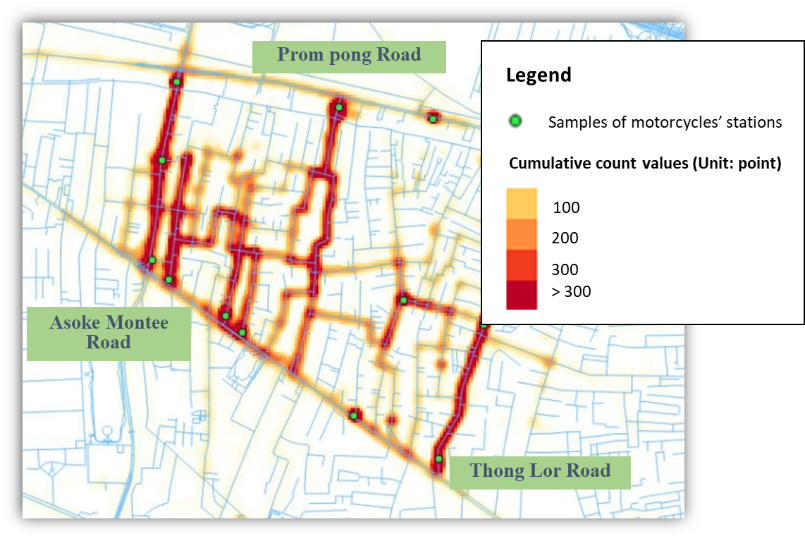
Probe data collection using low-cost GNSS © OpenStreetMap contributors
In collaboration with Group 3, we created a framework for questionnaire survey and analysis necessary for defining the evaluation axis for QOL measurement using personal probe data and agent modeling results of Group 1. In addition, we established a procedure for obtaining data from Google Timeline, which stores personal probes for smartphone positioning, and conducted research on the application of the data to evaluating location accuracy and estimating personal profiles. This has facilitated the acquisition of big data that can be applied to QOL measurement.
As a platform to support decision making and consensus building in the “Smart Transportation Integrated Strategy Methodology”, a policy planning method, we have studied the specifications of the platform for the shared infrastructure, and the platform for each data, with the aim of visualizing and sharing the resultant data from Groups 1 to 3 and the above information on the digital earth in a multi-scale and seamless manner. We examined the specifications of the platform for the shared infrastructure and the visualization of each data on the platform, and developed the 3D spatial urban data and visualization system that we have constructed so far to be deployed on the platform.
